Top 10 TradingView Indicators
Introduction
TradingView is one of the most powerful platforms available for charting and technical analysis. But with thousands of technical indicators to choose from, which ones truly stand out? In this guide, we highlight the best TradingView indicators that traders of all levels rely on to analyze trends, confirm momentum, and find entry and exit opportunities. Whether you're a beginner or an experienced trader, these technical analysis tools can help fine-tune your strategy.
What is a Trading Indicator on TradingView?
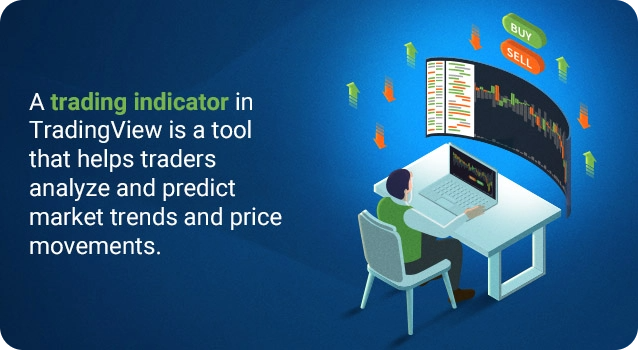
A TradingView Indicator is a mathematical tool that transforms raw price or volume data into visual signals on a chart. These signals help traders identify trends, potential reversals, and key decision points. From moving averages to custom-built tools, TradingView offers a wide range of indicators designed for both simplicity and advanced strategy development.
Top 10 best TradingView indicators
1 - Moving Average (MA)
A fundamental trend-following indicator, the Moving Average smooths out price data to help identify the direction of a market. Traders often use simple or exponential MAs to spot support and resistance zones or determine potential reversal points.

Find more information on the MA indicator on TradingView here.
2 - Relative Strength Index (RSI)
While less utilized for overall trend analysis than the more versatile Moving Averages, the Relative Strength Index (RSI) indicator is also often used for its clear overbought and oversold signals. This popular technical indicator measures the magnitude and velocity of price changes in an asset. It provides trading insights by identifying when an investment is overbought or oversold, indicating optimal reversal points. The RSI ranges from 0 to 100, with values above 70 indicating overbought trading conditions and values below 30 indicating oversold trading conditions.
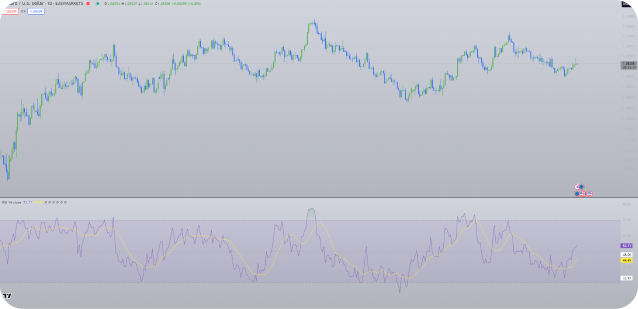
Traders can use the RSI to identify potential trade entry and exit points and confirm the strength of a trend.
Learn more about the RSI indicator on TradingView here.
3 - Moving Average Convergence Divergence (MACD)
MACD is a widely used momentum indicator that helps traders identify potential reversals, using two moving averages to show momentum and trend direction. A crossover of the MACD line above the signal line often indicates a buy signal, while the opposite suggests a sell. The MACD histogram provides additional insights into trend strength.
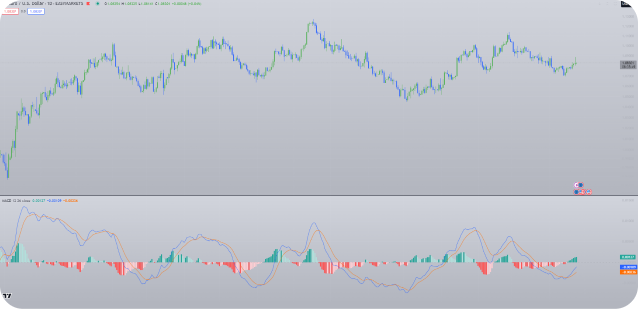
Find additional information on the MACD indicator on TradingView here.
4 - Bollinger Bands
This volatility indicator consists of a moving average with upper and lower bands representing standard deviations. When the bands widen, it signals higher volatility; when they narrow, market activity may be consolidating. Traders use this to identify breakouts or reversals.
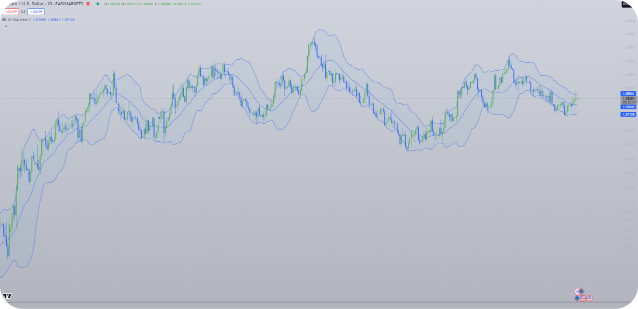
Find additional information on the Bollinger Bands indicator on TradingView here.
5 - Volume
Volume confirms the strength behind a price move. Spikes in volume often accompany breakouts or significant reversals, making volume a useful way to confirm whether a trend is continuing or coming to an end.
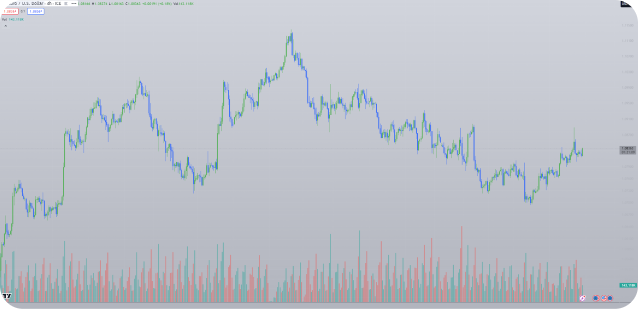
Learn more about the Volume indicator here.
6 - Stochastic Oscillator
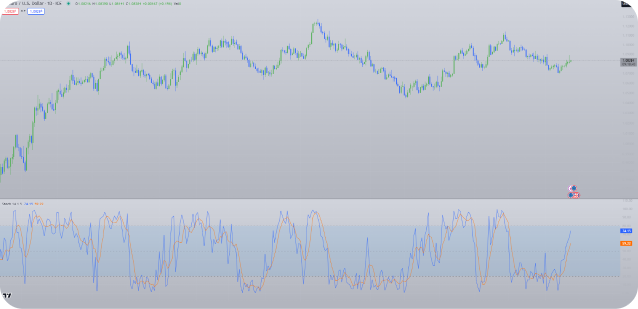
This momentum tool compares an asset’s closing price to its recent range, helping identify overbought or oversold levels. Crossovers between the %K and %D lines can signal potential trade entries or exits.
Learn more about the Stochastic Oscillator on TradingView here.
7 - Fibonacci Retracement
Fibonacci Retracement is a powerful support and resistance indicator that provides trading insight into areas of possible support and resistance. Inspired by the celebrated Fibonacci sequence, in which each number is the sum of the previous two, this tool helps chart significant price levels. These levels indicate areas where the market may reverse its current trend, pull back, or stabilize.
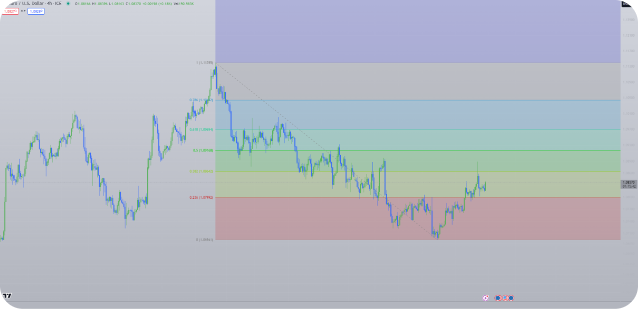
This indicator is particularly valuable, offering precise, measurable levels that help traders fine-tune stop-loss orders, set profit targets, or choose when exactly to enter the market.
Find additional information on the Fibonacci Retracement indicator on TradingView here.
8 - Average True Range (ATR)
The Average True Range indicator measures market volatility. While not a directional indicator, it helps determine optimal stop-loss levels by showcasing how much an asset typically moves over a given time period.
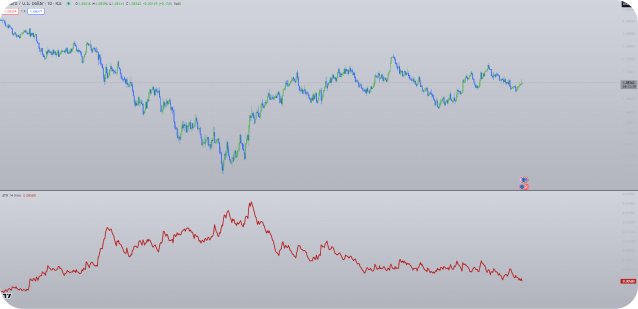
Learn more about the ATR Indicator on TradingView here.
9 - Parabolic SAR
This trend-following indicator places dots above or below the price to show direction. When the dots flip sides, it may indicate a reversal. It's a popular tool for setting trailing stop-loss orders.
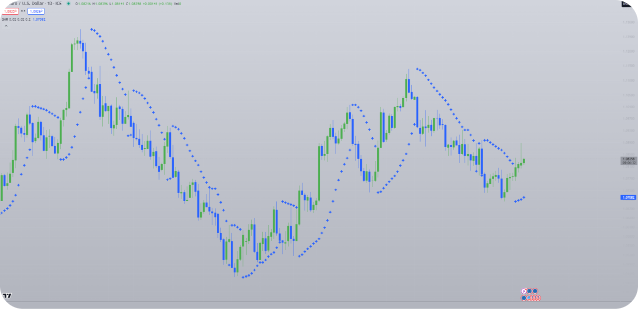
Find additional information on the Parabolic SAR indicator on TradingView here.
10 - Ichimoku Cloud
An all-in-one indicator, the Ichimoku Cloud Indicator provides insights into trend strength, support/resistance, and momentum. While visually complex, it’s incredibly versatile and ideal for experienced traders interested in deep market structure analysis.
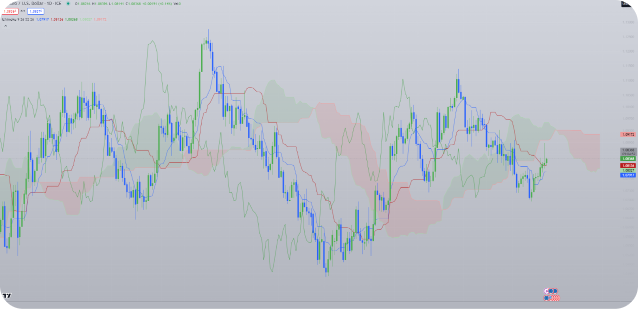
Traders examine the interactions between the various Ichimoku Cloud lines to determine the best moments to initiate or conclude trades.
For example, traders using the Ichimoku Cloud look for price movements above the Cloud as a buy signal and below the Cloud as a cue to sell. Movement within the Cloud suggests the price stays the same. Additionally, the Cloud's color offers insights into market direction: a green Cloud – resulting from the Leading Span A (Green Line) being above the Leading Span B (Red Line) – signals an uptrend, whereas a red Cloud indicates a downtrend. The Cloud’s 26-day forward projection allows traders to anticipate potential support and resistance levels, providing a valuable edge in strategic planning.
Beyond identifying entry and exit points, these insights help traders set up stop-loss orders to manage risk more effectively. The indicator’s lines further reveal insights into overall market sentiment. By combining multiple aspects of technical analysis into a single framework, the Ichimoku Cloud empowers traders to make more informed trading decisions and better anticipate market movements."
Want to learn more about the Ichimoku Cloud? Read more on TradingView here.
Key takeaways
These indicators each serve a specific purpose – trend detection, momentum measurement, volatility analysis, or support/resistance identification. When thoughtfully combined, they create a comprehensive technical analysis toolkit to support your strategy on TradingView.
If you're using TradingView via the easyMarkets account, you’ll also benefit from exclusive features like Guaranteed Stop Loss with No Slippage* and negative balance protection, all integrated into your trading experience.
A word of caution
While these tools can guide your decisions, relying on a single indicator or misunderstanding signals can lead to costly mistakes. For example:
- Misreading MA crossovers during choppy markets
- Overvaluing RSI without confirming trends
- Using Fibonacci levels in isolation
- Misinterpreting Ichimoku Cloud signals without understanding its layers
Always validate signals with multiple tools and keep an eye on the broader market environment.
Introduction
TradingView is one of the most powerful platforms available for charting and technical analysis. But with thousands of technical indicators to choose from, which ones truly stand out? In this guide, we highlight the best TradingView indicators that traders of all levels rely on to analyze trends, confirm momentum, and find entry and exit opportunities. Whether you're a beginner or an experienced trader, these technical analysis tools can help fine-tune your strategy.
Frequently Asked Questions
You can use these tools to identify trends and signals for your trade. The easyMarkets platform offers additional tools and features for executing trades effectively, including exclusives like Guaranteed Stop Loss with No Slippage* and negative balance protection.
No, they are standard on TradingView, but the easyMarkets platform offers a unique combination of indicators with exclusive risk management features.
Their effectiveness depends on your strategy, assets, and timeframe. Indicators are best used as part of a broader, well-tested approach.
*Guaranteed Stop Loss with no Slippage is only available on easyMarkets web & app trading platform. Activate with a wider spread for total risk control.